I thought building an agent runtime would mostly be about prompts, tools, and model APIs. It wasn’t. Most of the work was making the system behave the same way on Tuesday night as it did on Monday morning. LangChain calls this layer the agent harness: everything that isn’t the model. If I had to split where my time went over the past year, maybe 30% was the model integration and 70% was the harness.
State can’t live in the process
An agent execution takes minutes, involves a dozen tool calls, and produces a conversation history that the next turn depends on. If that state lives only in memory and the process restarts, everything is gone. I moved the execution-critical state to durable storage early on. Conversation history, tool call results, execution config. Persisting state solved restarts. Safe resumption still required coordination around retries and side effects, but the foundation was having the state survive the process.
The part I didn’t think about until it bit me: the execution config needs to be frozen at the start. I snapshot the full configuration at creation time: which model version, which tools are available, the system prompt, token and turn budgets, retry policy, temperature. The snapshot is immutable for the entire execution lifecycle, including retries and resumes. If I change a prompt while an agent is mid-execution and it resumes later, it picks up the original prompt, not the new one. Before I did this, resumed executions behaved differently from when they started, and I’d spend an hour debugging what turned out to be a config change I made between runs. The snapshot protects in-flight executions from my own config changes, even though external dependencies like third-party APIs can still change underneath them.
The logs showed what the agent did, but not the full chain of why.
Traces, not logs
I had structured logging on every tool call pretty early. Tool name, parameters, duration, token count. Useful for finding slow tools or bloated responses. But when a user said “the agent gave me a weird answer,” I still couldn’t figure out what happened. The logs showed what the agent did, but not the full chain of why.
The fix was distributed tracing across the request path. Across the services I own, one trace ID ties the whole path together.
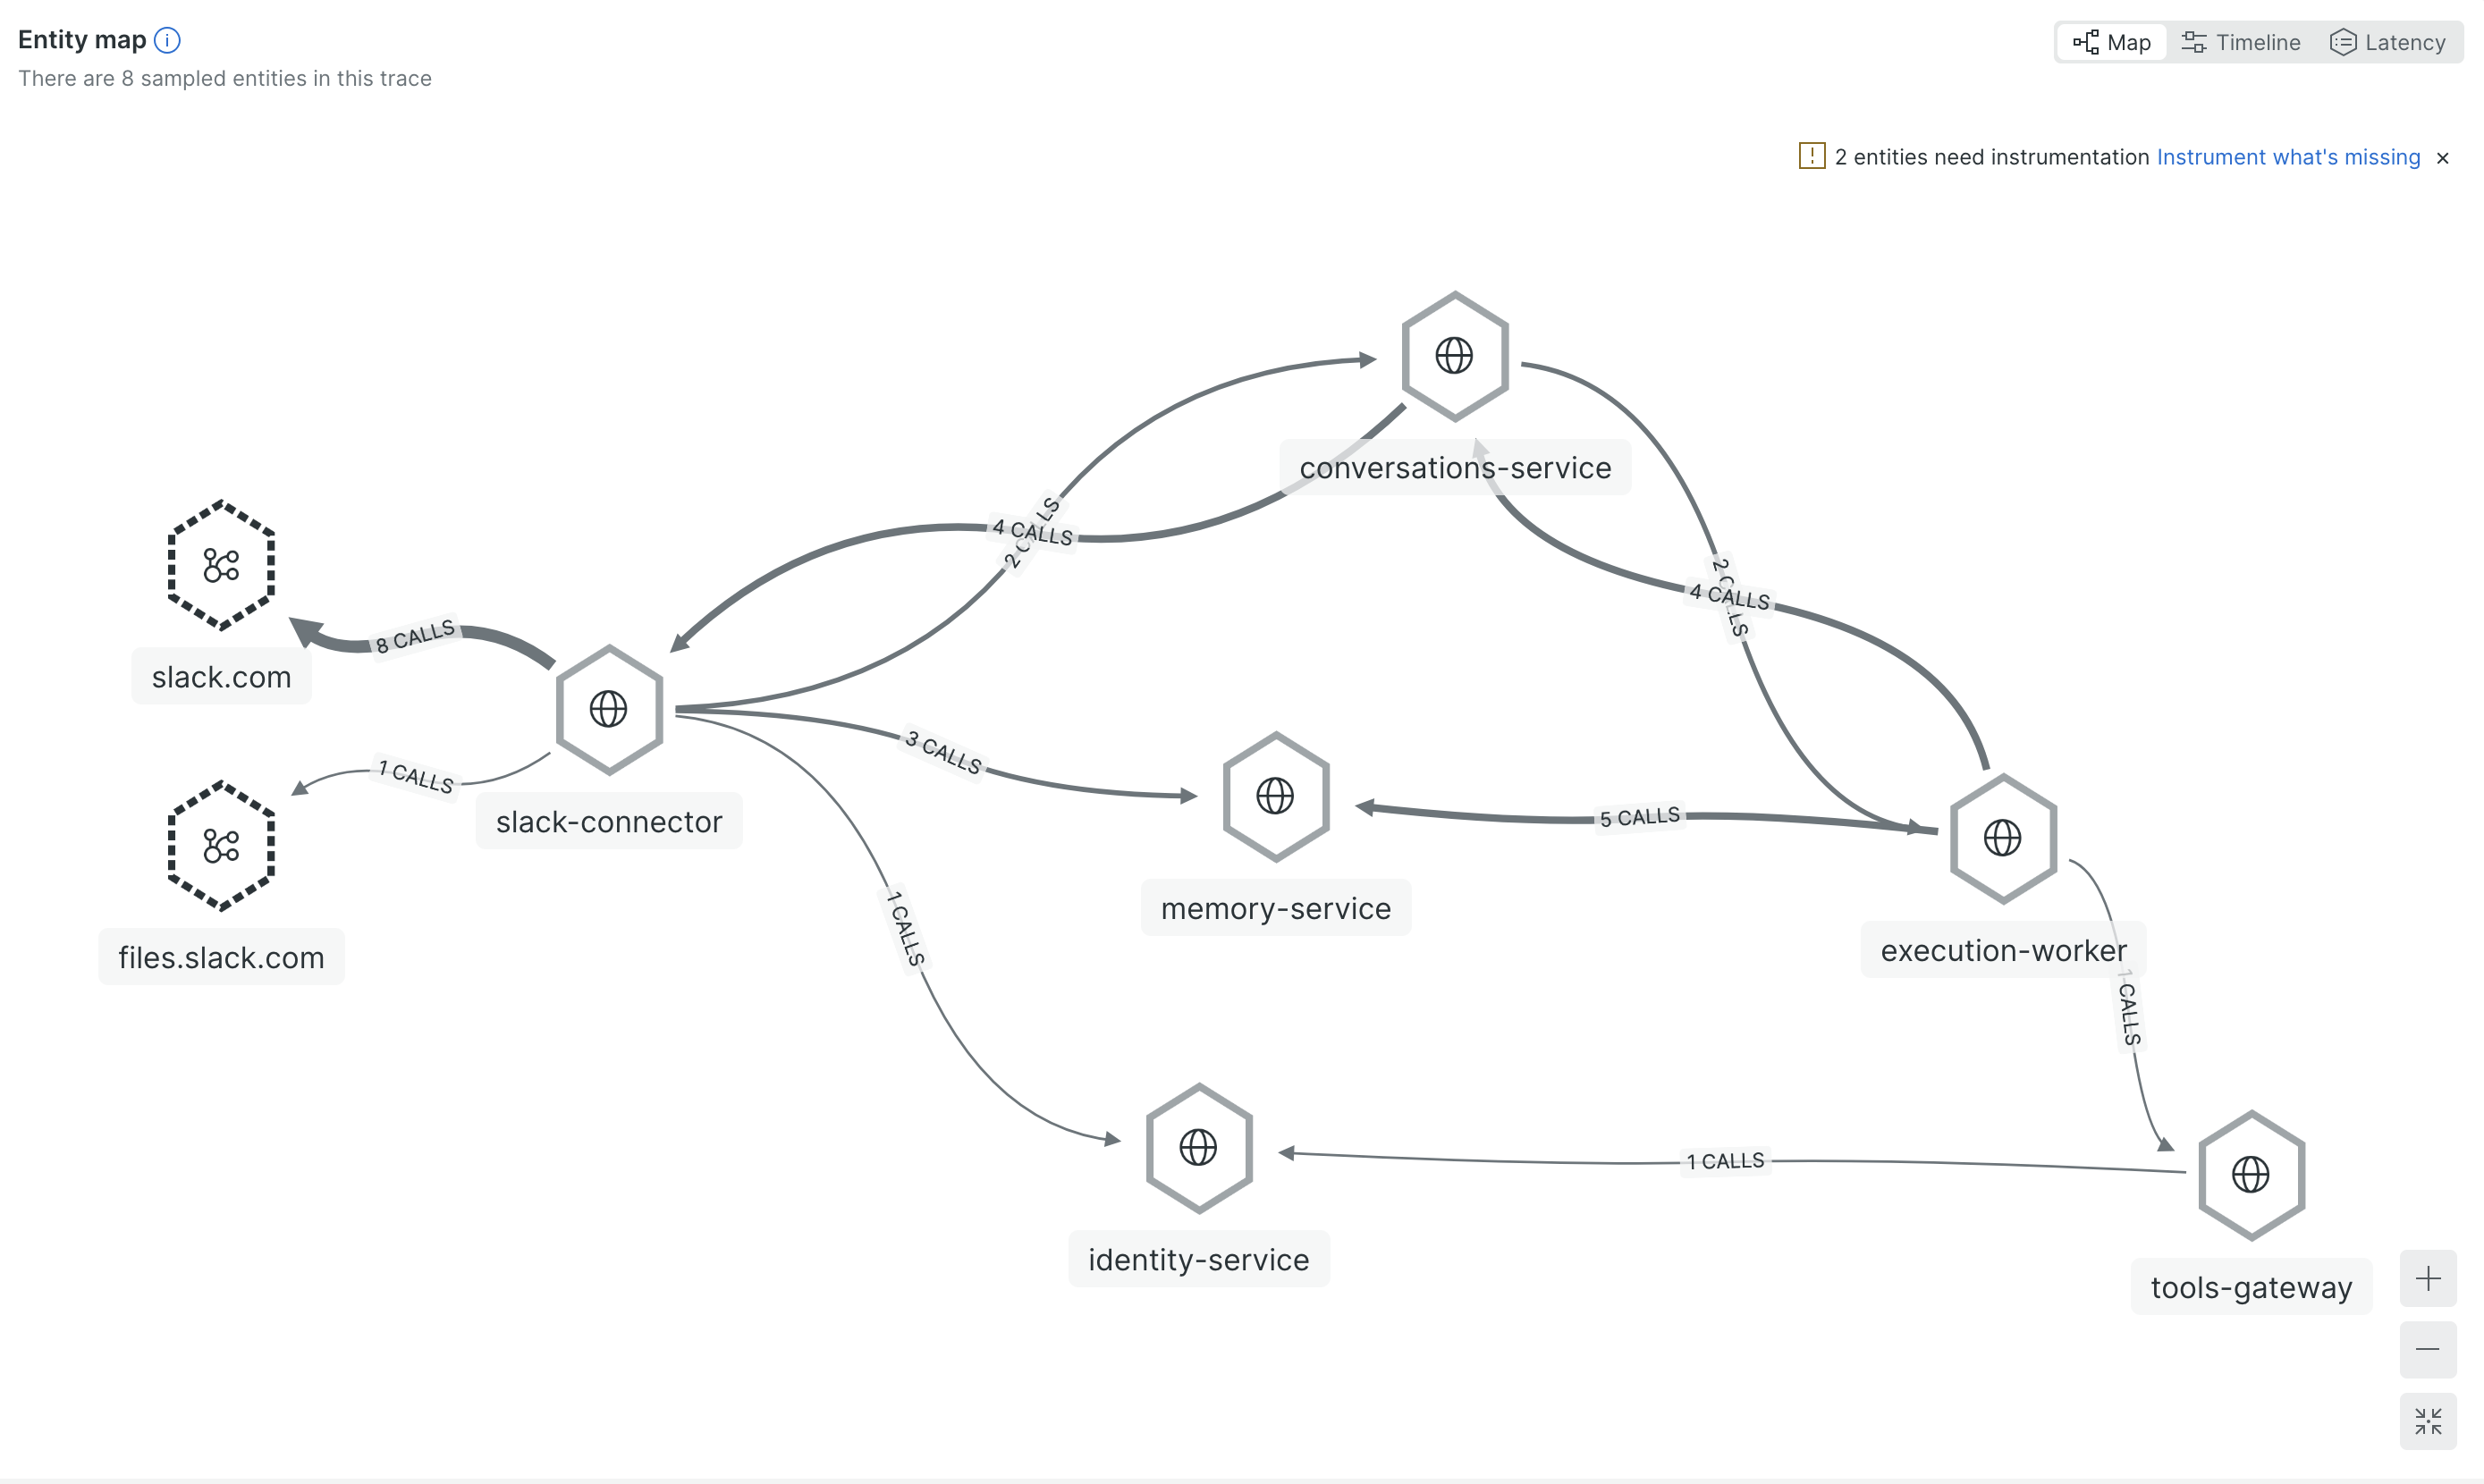
When something goes wrong, I search by that trace and see everything: where the message entered, which execution handled it, which tool call took 8 seconds, which API returned garbage data. Without this, I was grepping across 4 services trying to piece the story together. With it, I click one link and read it top to bottom.
The specific thing that made me set this up: a tool was returning 40KB responses that ate half the agent’s context window. After that response landed in context, later steps were often worse. The trace made it possible to correlate the quality drop with the oversized tool response. I could see it in the logs (high token count on one call), but I couldn’t understand the downstream effect until I could see the full execution flow.
There are two practical ways to handle oversized results that I’ve tried. One is keeping a compressed slice in context and storing the full output separately (LangChain calls this tool call offloading). The other is programmatic tool calling where the agent runs code in a sandbox to filter and extract what it needs from the raw result instead of dumping everything into context. In my case I mostly catch these problems by watching traces and fixing tools when I spot them. Users flag issues too, things like “the agent didn’t include X in the report.” A surprising number of those turn out to be integration gaps rather than model failures: the field exists in the UI but the tool doesn’t return it, because nobody mentioned it was important when we built the integration.
The next step is flagging potentially broken runs automatically: unusually high token counts, repeated tool calls with the same parameters, suspiciously short outputs. Then a separate process reviews those runs to identify where things went off track. Manual review doesn’t scale, so the review itself needs to be at least partially automated.
Tell the model what went wrong
When an execution fails and gets retried, the default approach is to run it again from scratch. Same prompt, same tools. In my runtime, a retry started as a fresh attempt unless I explicitly carried failure context forward. The model tried the same thing and hit the same problem.
I started injecting failure context into retries. The model sees something like: “This is attempt 2. The previous attempt failed because the API returned a timeout on a large query. Consider using more targeted queries.” But the failure message alone isn’t enough. I found retries worked better when the model also saw a compressed version of the failed attempt: the tool call sequence, truncated results, and the failure reason. Without that history, it doesn’t know what approaches were already tried. With it, it can pick a different strategy instead of walking into the same wall.
In practice, adding failure context improved retry success more than I expected. Unlike a conventional retry loop, a model conditioned on the previous failure can choose a different strategy on the next attempt. A web service retries the same request because the failure was transient. An agent retry is different because the approach itself can change.
The tradeoff is how much failure context to inject without polluting the new attempt. Too little and the model repeats the same mistake. Too much and it over-indexes on the previous failure and avoids valid approaches that happen to look similar. I currently keep the tool call sequence and truncated results (under 500 chars each) plus the error message. LangChain tackles a related problem from the other direction in their deep agents work: instead of enriching retries with context, they detect when an agent is looping on the same broken approach and interrupt it with a middleware that says “reconsider your approach.”